
I Built a Free GPU + CPU Temp Overlay (In One Afternoon)
Build logBy SuperZydan7 min read
- Tools
- PC
- Streaming
- Open Source
- Claude Code
Part of SuperZydan Temp Widget
Download on GitHub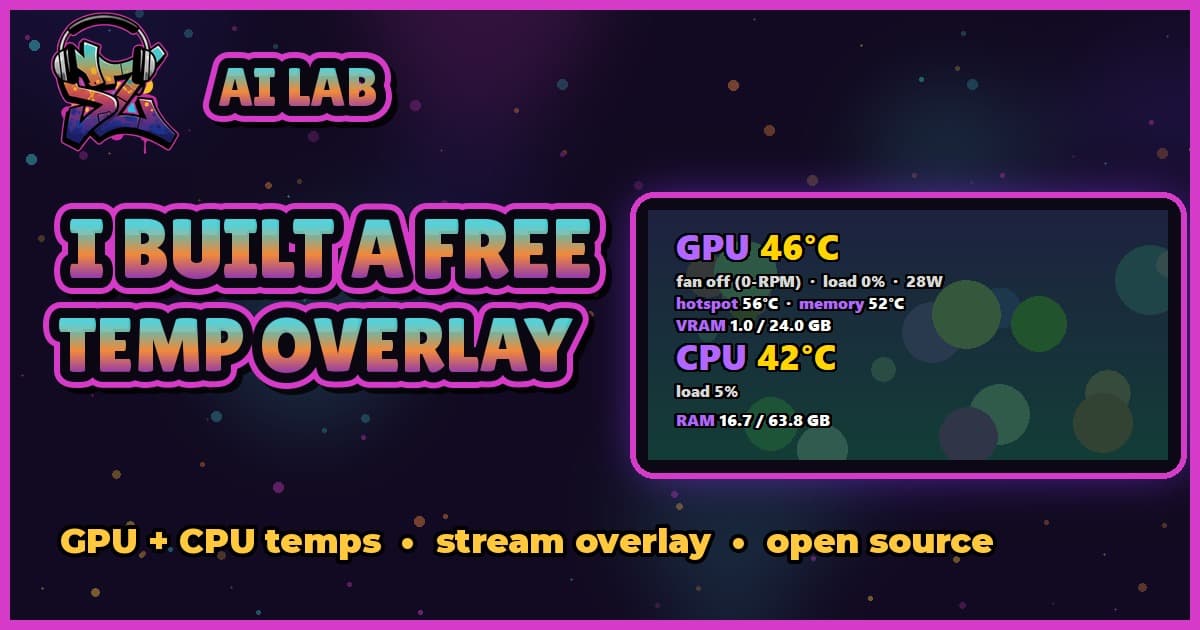
It started with a small scare. I was sitting at my PC, the computer was clearly running, and I noticed my RTX 4090's fans weren't spinning. At all.
So I asked Claude to check my GPU temperature. Then I thought, why stop there? Let's build something that shows me my temps all the time.
A few hours later I had a full temp widget, a stream overlay, a settings window with a color eyedropper, and a public GitHub repo anyone can download for free. Here's how it went.
Download it free: SuperZydan Temp Widget on GitHub
First, the fans
Turns out nothing was wrong. The 4090 has a zero-RPM mode: below roughly 50 to 60°C, the fans shut off completely to keep things quiet. My card was sitting at 46°C, basically idling, so the fans were just chilling too.
Good to know. But I still wanted to see that number without opening a bunch of apps.
Version 1: a see-through widget
The first version was simple: a transparent, always-on-top overlay that sits on my desktop and shows GPU temp, fan speed, load and power draw. White text, thick black outline, purple labels. Same look as my brand.
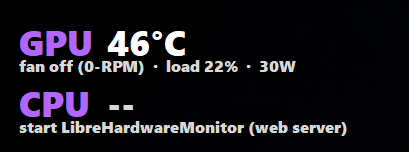 The very first version of the widget
You can see the catch right there: the CPU said "--". Windows doesn't let normal apps read CPU temperatures. You need a hardware monitoring program with a driver for that.
The fix was LibreHardwareMonitor, a free, open-source monitoring tool. It has a built-in web server, so the widget can just ask it for the CPU temps. Once that was set up (plus its PawnIO driver), the CPU line filled in.
Then I made it feel like a real app:
- A desktop icon with a custom thermometer icon in my yellow and purple
- Starts automatically when I log in, with LibreHardwareMonitor starting first
- Everything lives on my projects drive, nothing scattered around
Both programs together use well under 150 MB of RAM and almost no CPU, and neither touches the GPU. So it doesn't get in the way of games or my AI projects.
Then I kept adding stuff
Once it worked, the ideas kept coming. Here's everything that got added along the way:
More info. VRAM and system RAM usage, plus the GPU hotspot and memory junction temps. The 4090's memory runs hotter than the core, so that one's worth watching. If your card doesn't report a sensor, that line just hides itself.
A compact layout. A one-line version that fits along the top of your screen:
 The compact horizontal layout (swipe to see it all) (scroll sideways to see it all)
A stream overlay. The widget runs a tiny web page you can add to Streamlabs or OBS as a browser source, so viewers can see your temps live. It only listens on your own PC, so nothing on your network can reach it.
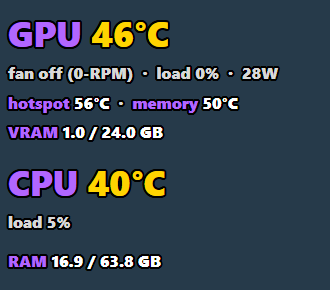 The stream overlay version
A settings window with checkboxes. This one came from me realizing not everybody wants to see everything. You can turn every line on or off, separately for your desktop and your stream overlay. So you can show less on stream than you see yourself.
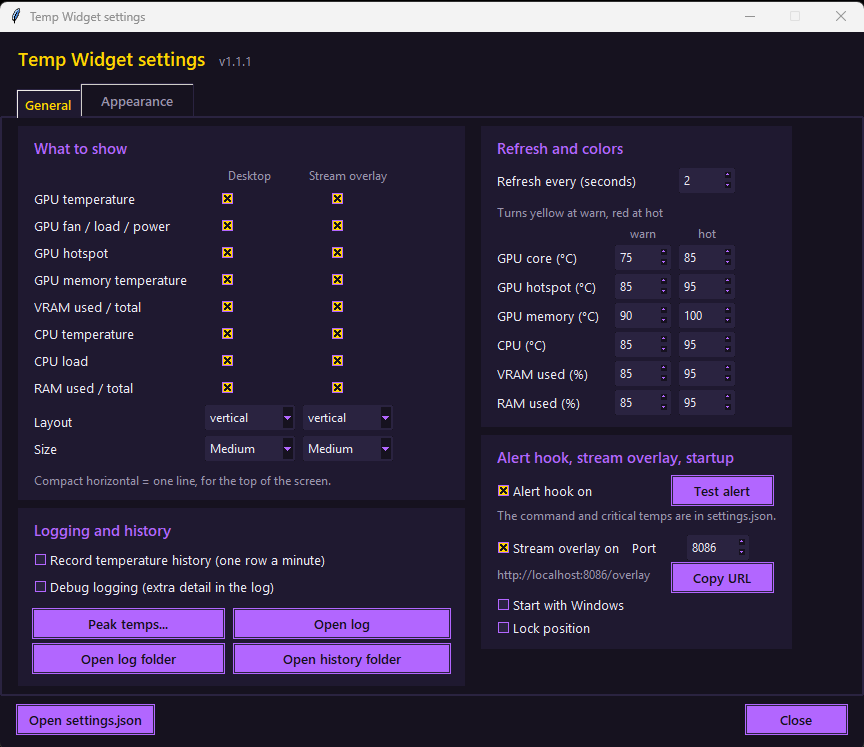 The General settings tab
Colors, fonts and an eyedropper. If you don't like my purple and white, change it. Every color has a picker, a hex code box, and an eyedropper that grabs a color from anywhere on your screen. You can pick your own fonts and outline thickness too, and give the stream overlay its own look.
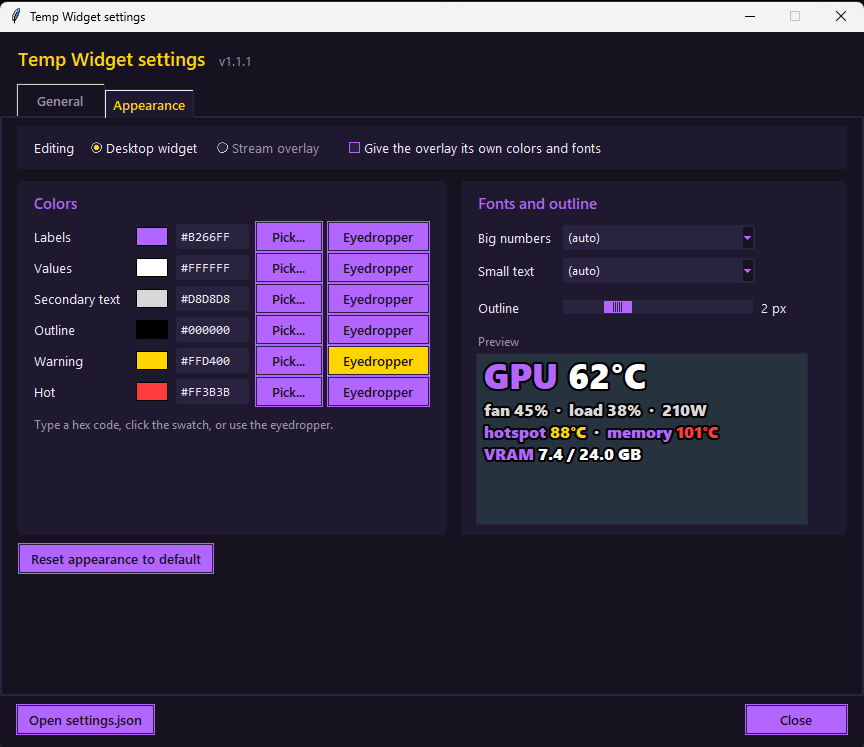 The Appearance settings tab
Critical alerts, but only when it matters. I didn't want something beeping at me every time a game got warm. Alerts only fire if a temp gets high enough to actually be a problem (like 88°C on the GPU core), stays there for 10 seconds, and then won't repeat for 5 minutes. When it fires, it can run anything: Windows text-to-speech, a Discord message, or your own AI assistant. Mine is hooked up to my AI voice assistant, Klaris, so she tells me out loud. (More on her in a future AI Lab post.)
Logs and temperature history. If the widget ever crashes, it writes down exactly why. It can also record your temps once a minute, and a Peak temps window shows the hottest your PC got this session and today, and when. That's handy for checking whether anything ran hot overnight while a long job was running.
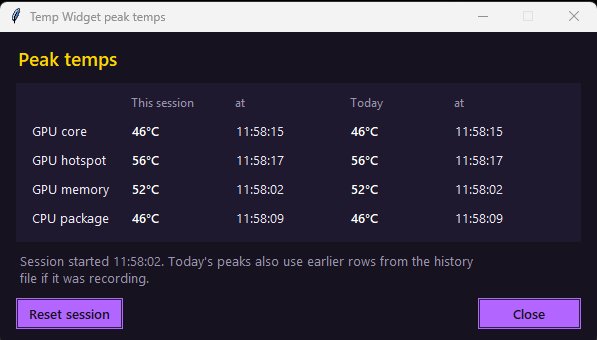 The Peak temps window
Behind the scenes
I built this with Claude and Claude Code. I'd describe what I wanted, and they'd build it, test it, and fix things as we went.
One funny moment: at one point I looked over and saw two widgets on my screen, one flickering and one saying "nvidia-smi not found." I thought it was broken. It was just Claude Code testing the new version. It was running a test copy side by side and faking a sensor failure on purpose to make sure the error logging worked. I'd forgotten it was even working on it.
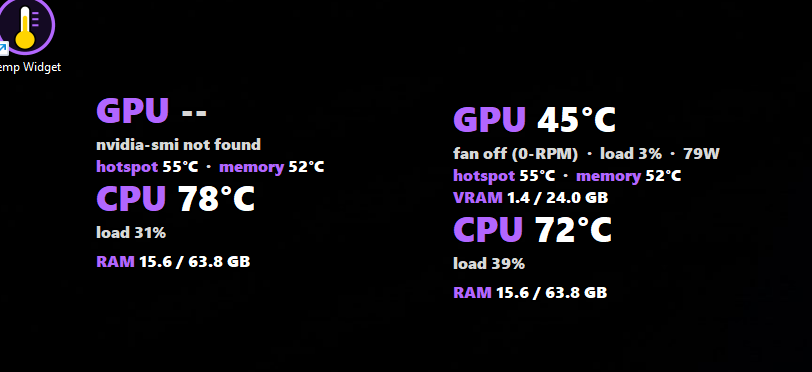 Two widgets during testing
Before anything went public, everything got a privacy check: no personal info in the code, the screenshots, or the commit history. If you're building in public, do this every time.
The final result
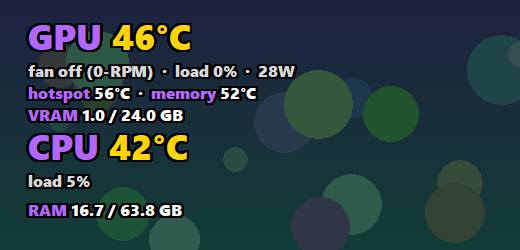 The finished widget
SuperZydan Temp Widget shows:
- GPU temp, fan, load and power
- GPU hotspot and memory temps
- VRAM and RAM usage
- CPU temp and load
And it has:
- Vertical or compact one-line layout
- A stream overlay for Streamlabs and OBS
- A settings window to turn every line on or off
- Custom colors, fonts and an eyedropper
- Critical temp alerts you can hook into anything
- Crash logs, temp history and peak temps
- One Python file, nothing extra to install, free and open source (MIT license)
Get it
Download: github.com/SuperZydan/SuperZydan-Temp-Widget. Grab the zip from the latest release on the right side of the page.
You'll need:
- Windows 10 or 11
- An NVIDIA graphics card
- Python 3 (free from python.org)
- LibreHardwareMonitor with its web server turned on (for CPU temps)
Setup steps are in the README on GitHub. Double-click the launcher, and you're good.
Got an idea for a feature, or found a bug? Open an issue on GitHub or email me at superzydanofficial@gmail.com. It's one of many builds in my AI Lab, and there's a lot more coming.
Free and open source. Grab it from GitHub.
Download on GitHub